

P5 | Visualizations | Literature Review
This project was inspired by a weekend effort to read and understand all the papers in the last published ISMIR conference at the moment. I found this to be a great exercise to paint a map of the current state of the art and common interests of different research groups. I definitely recommend every student to do this exercise for a complete picture of the motivation and to find what interests you the most.
In order to map this out onto a better way to visualize the research, I created a CSV file with each of the papers in the proceedings (Currently only done on 2017), the author names and identified tag (deep learning, musicology, new dataset, new software etc.). Along with this I also identify the country of affiliation of the authors and visualize on a map texture. Here is a screenshot of the same.
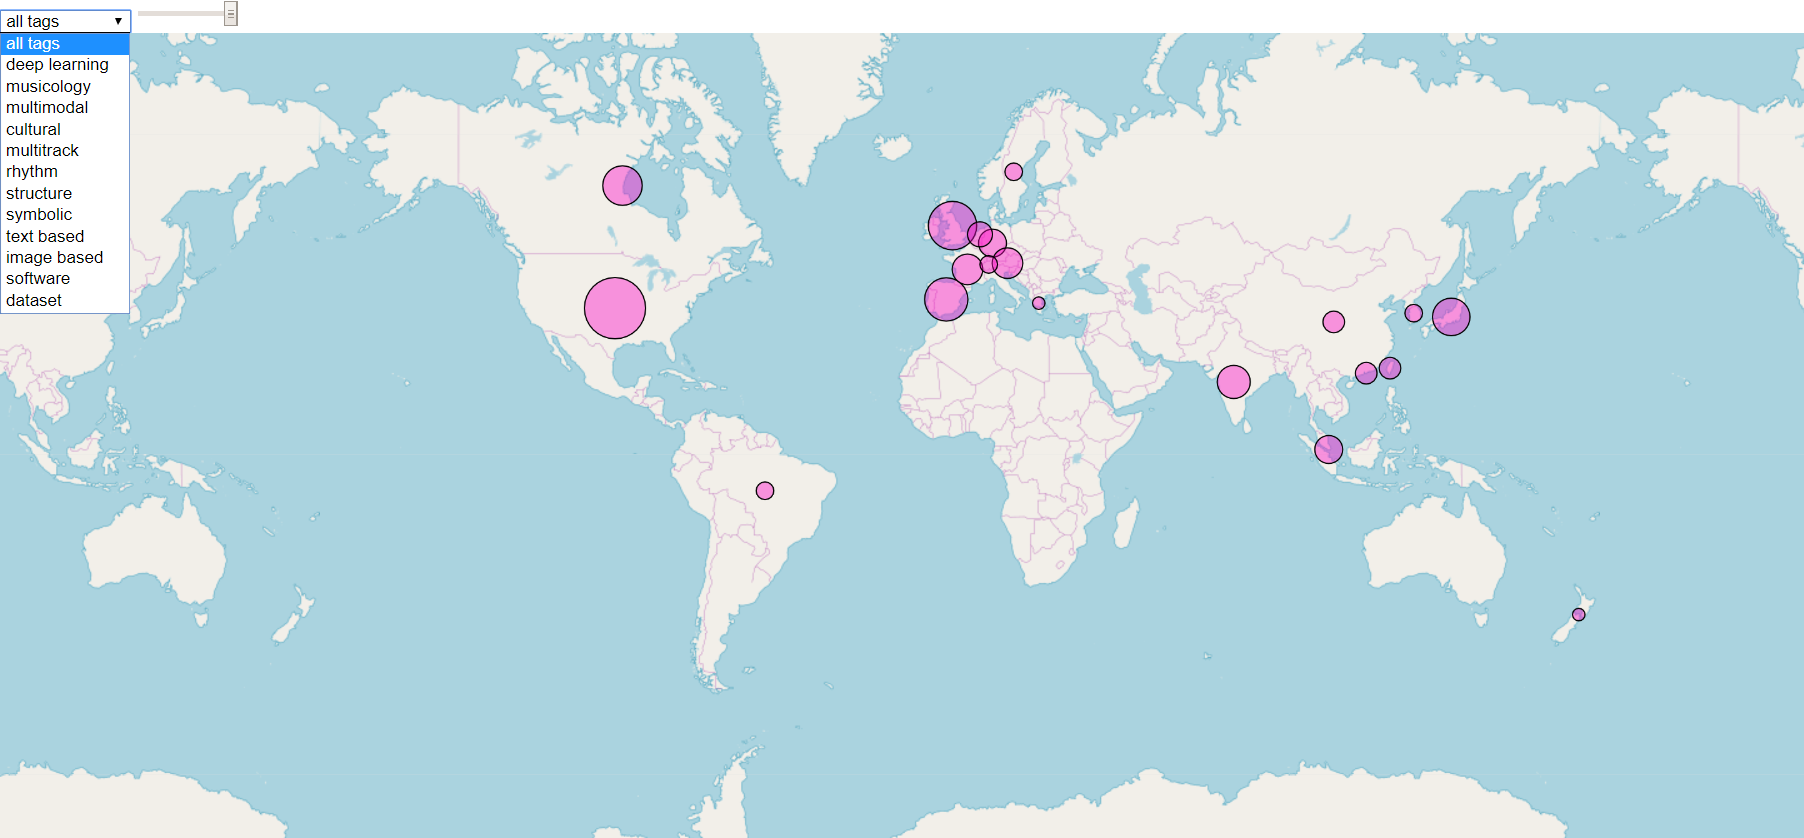
The size of the circles corresponds to the number of papers of the selected tag from the particular country.
Here is an image of a selected tag of “deep learning”
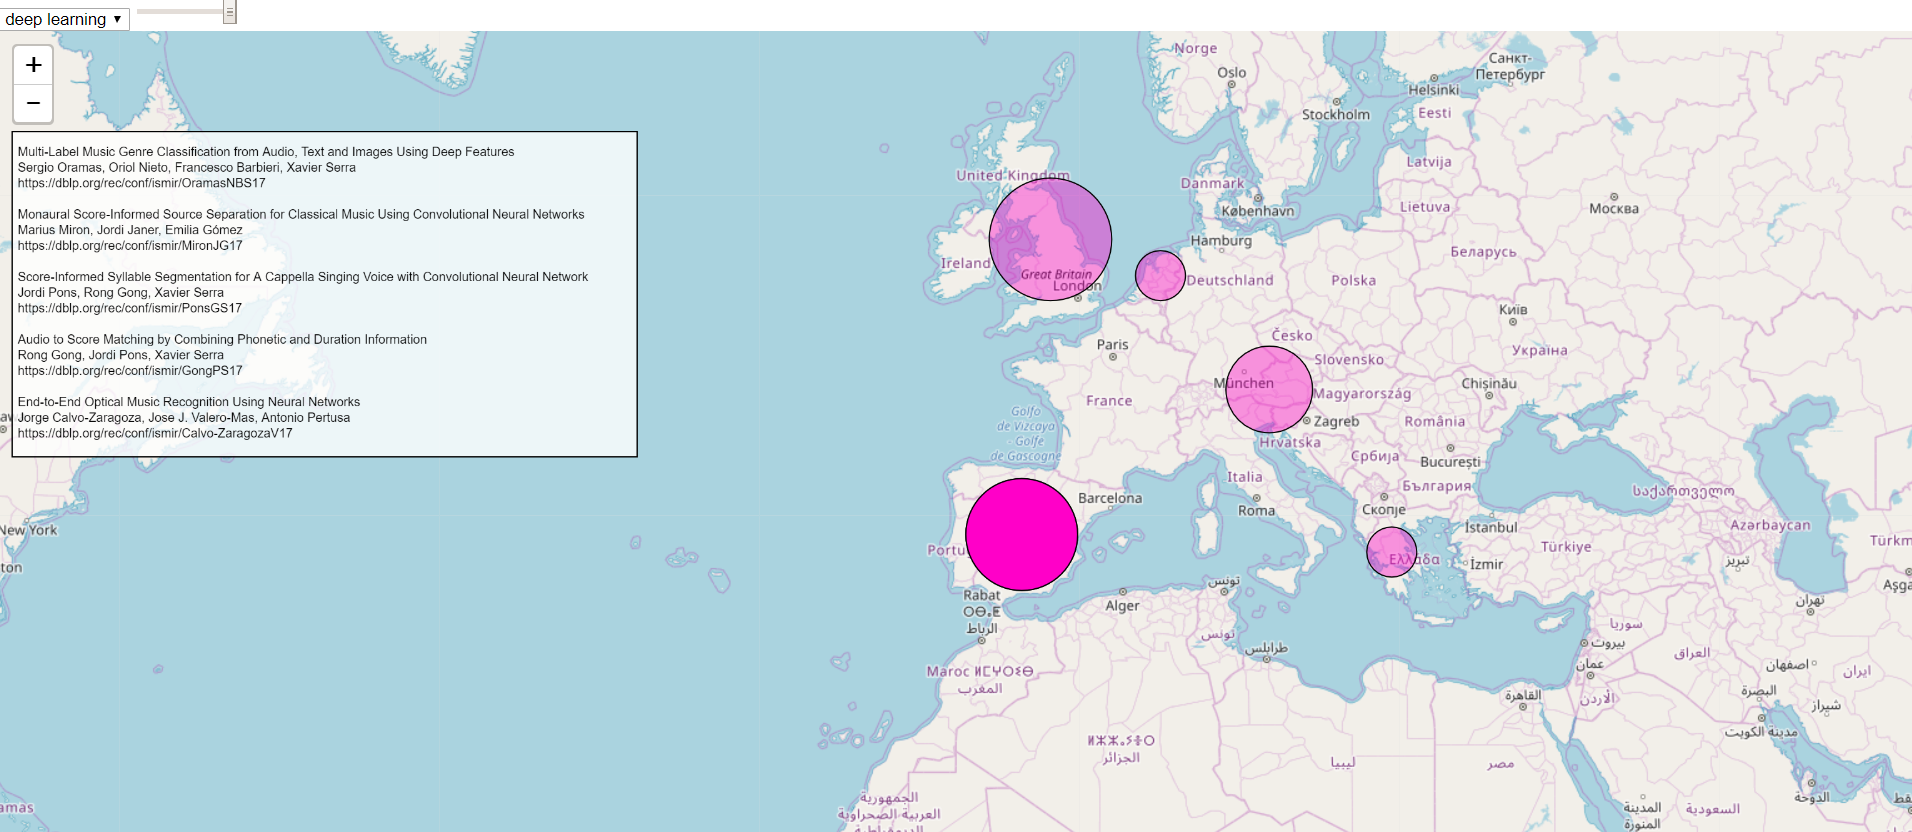
As you can see, selecting any of the circles, lists the papers. I think this could be a nice way to not only visualize the kind of research geographically but also to query labs that are pursuing research in a particular field.
The codes used to implement this (and CSV files for the proceedings metadata) are available on the following Github Repo
The interactive browser demo will be hosted here soon.
